How Can We Help?
Telemetry Log
One of the important function of any Modern Drone is to be able to Log information onboard black box or ground station telemetry from Two things ,
- Drone Internal Condition – this is IMU Sensors information , PWM input and Output ,Battery Health, GPS coordinates
- External Environmental factor – Windspeed, atmospheric pressure , air quality , thermal and Visual
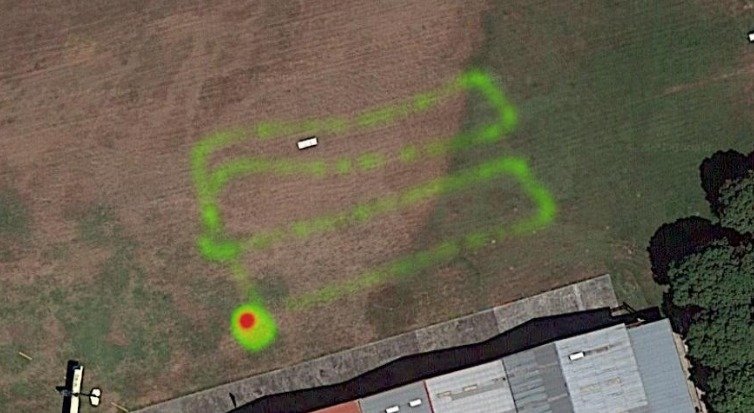
this what makes telemetry Log useful isthe ability to gather data about the drone and enviroment and present it into a chart or map over lay
FlyWii GUI Logging
For External ADC Senors First connect the Drone and go to GUI settings and Change the Battery Cell Count to 1s as we are using it for sensor signal mode.
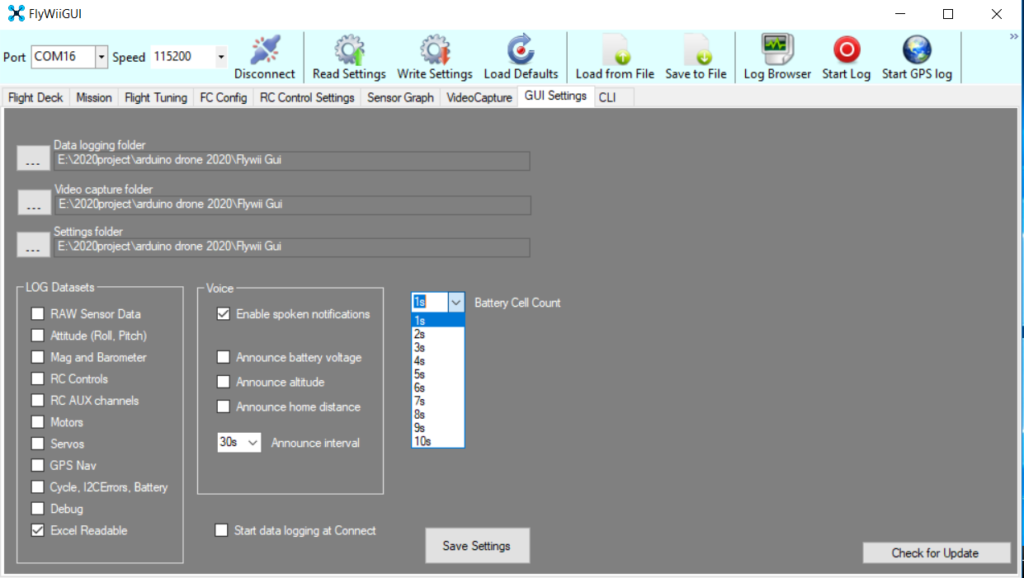
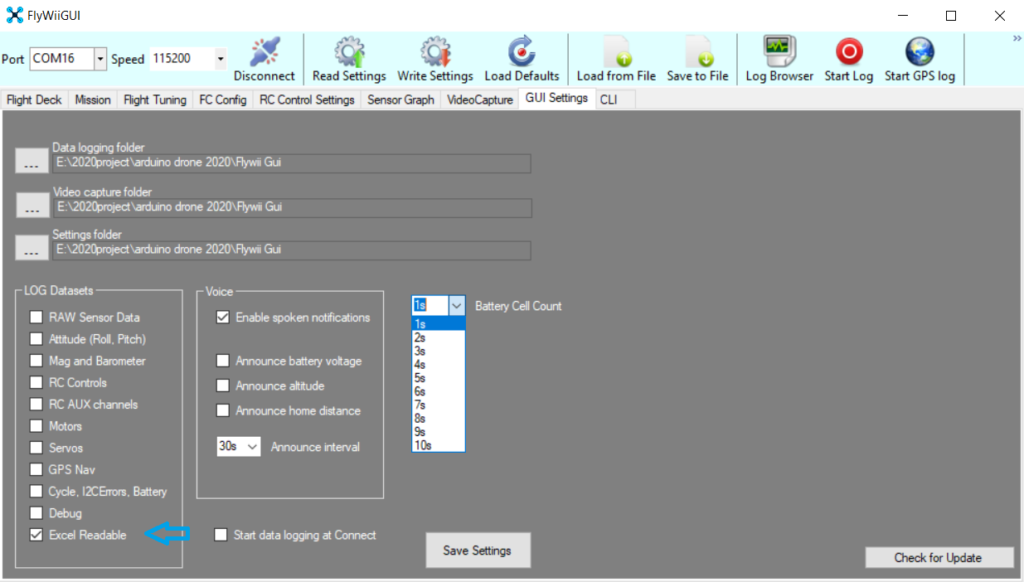
make sure you know where your file is save when Log is active (Logging Folder)
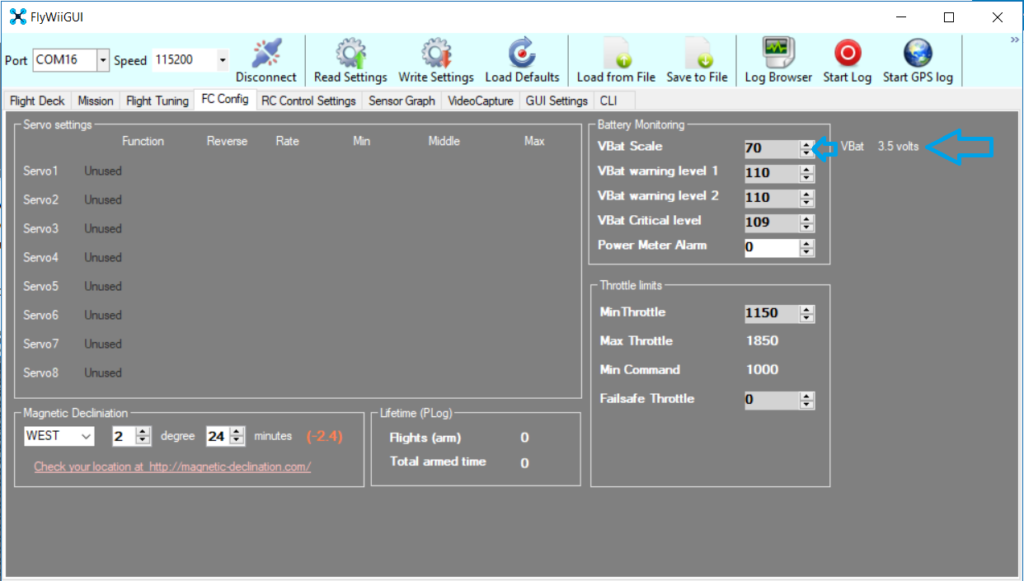
Use the Vbat scale to adjust the output till the number Matches the ppm concentration numerical value of the Control Sensor
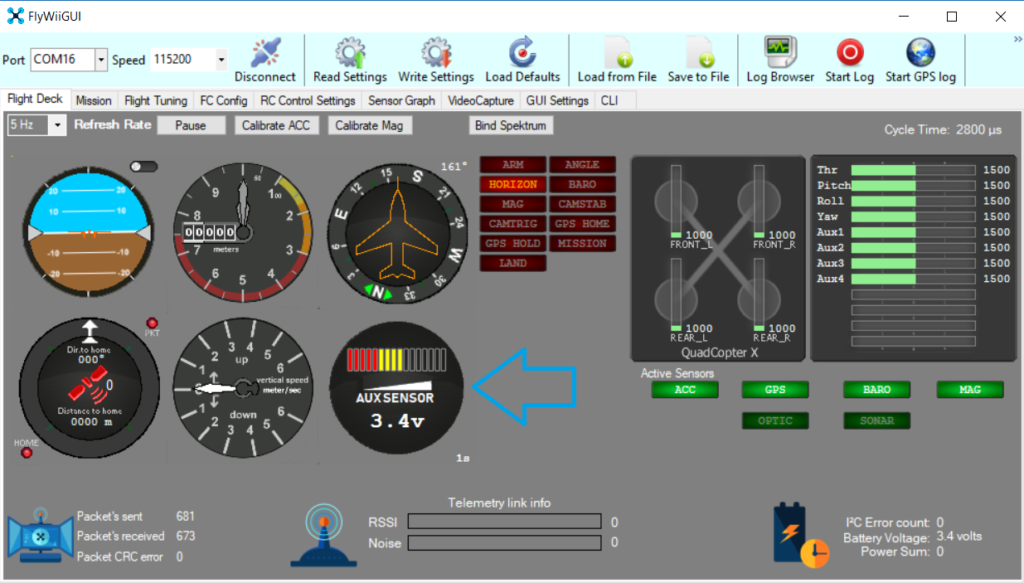

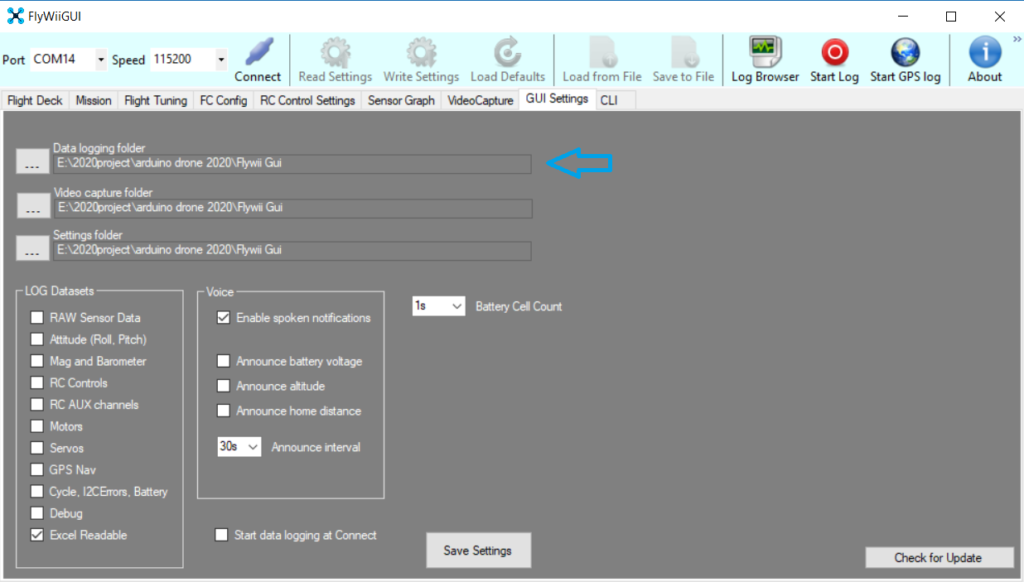
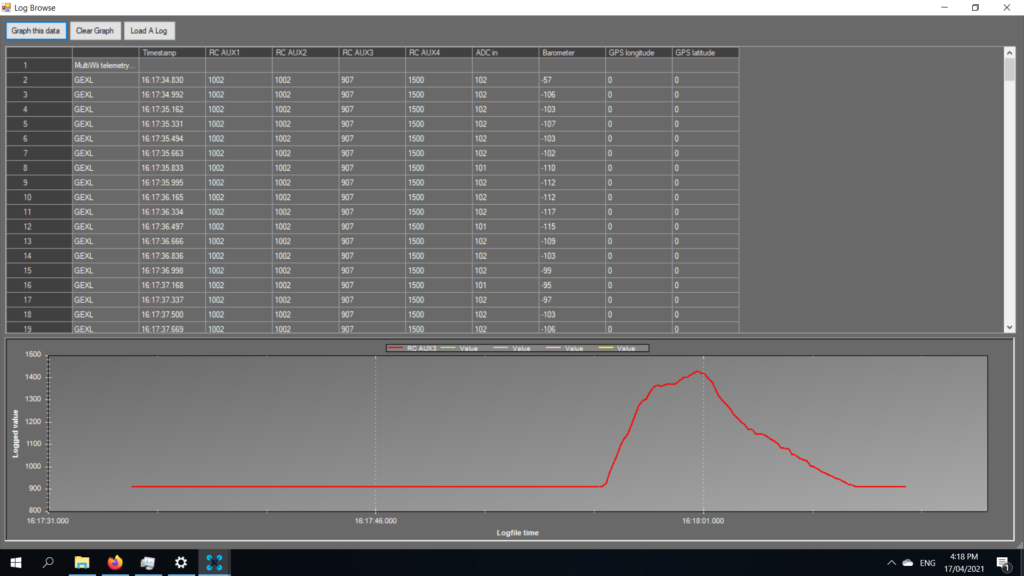
Note: that for the Ao ADC sensors in this sample the Graph selected is the ADC in
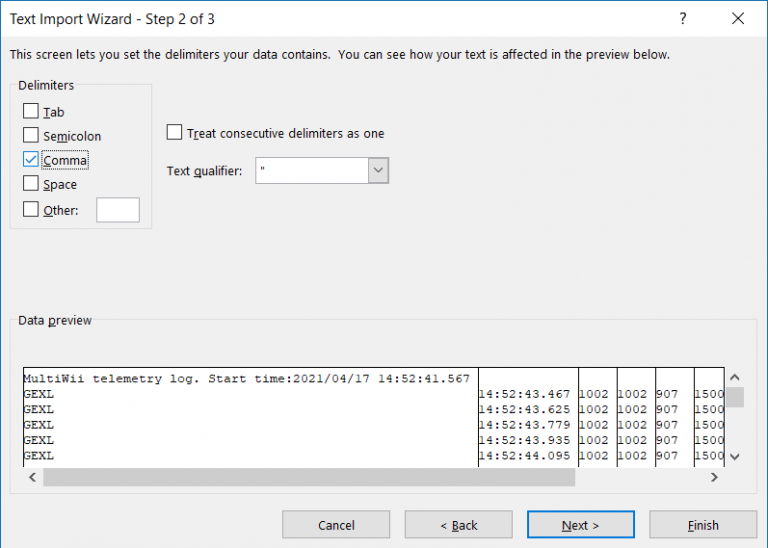
Open .log files in MS Office Excel (Old Version)
For earlier MS excel you first need to locate the .LOG file Extension and rename it TXT or CSV and use txt/csv import wizard to import it

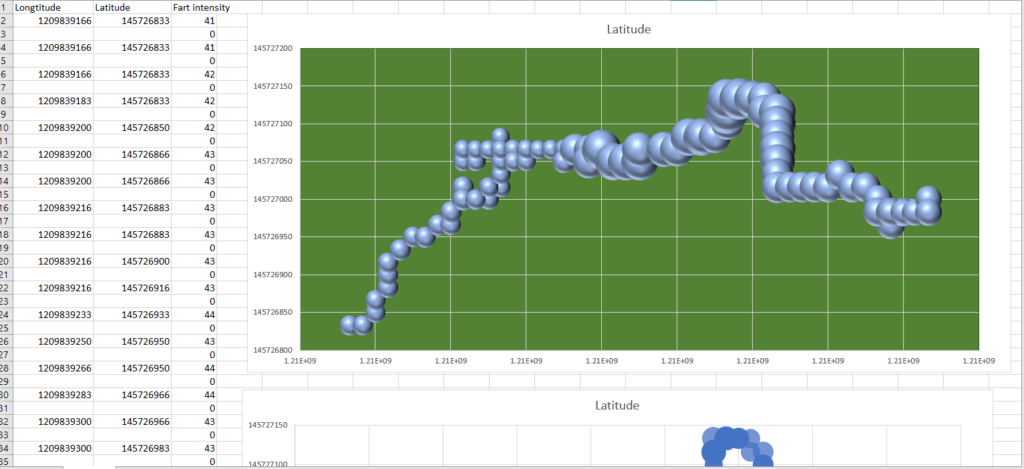
Data is best presented as Scatted Bubble Chart Longitude-X Latitude-Y Bubble size as ADC in to be on your graphs . Aux 1-4 may be used if your sensor happens to be augmented with RC PWM standard
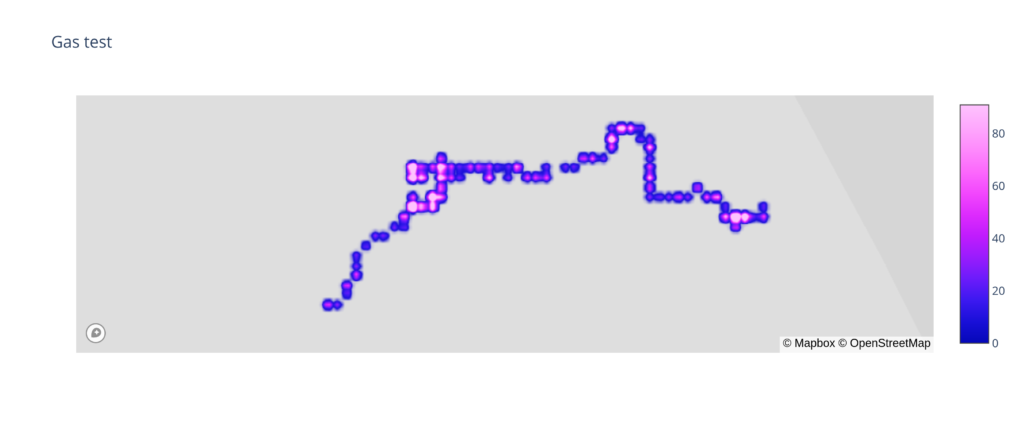
This shows a bubble chart of the coordinates the samples were taken and the Bubble size of the intensity of concentrations.

http://www.synerflight.com/project/plot1gas/
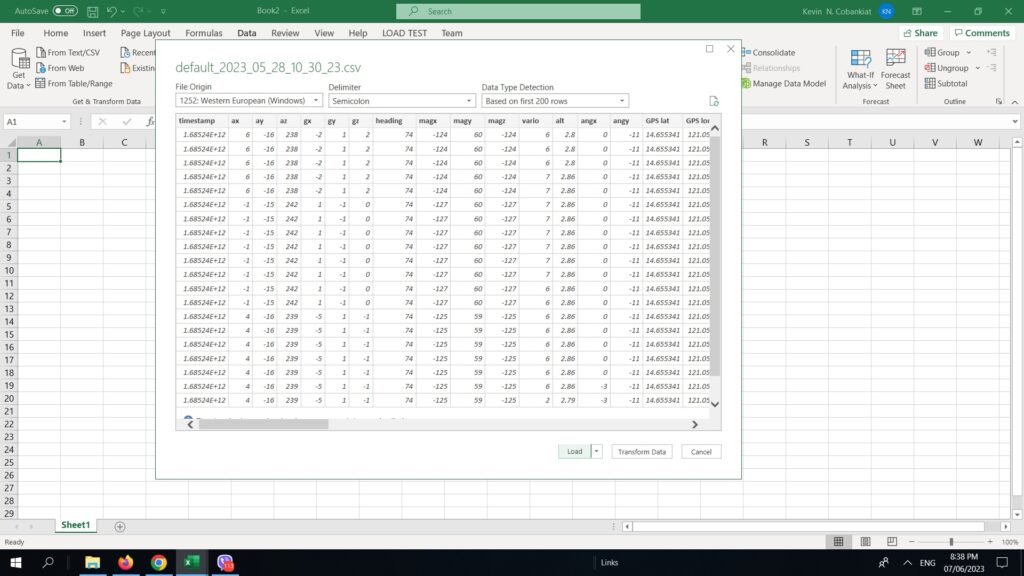
Open .log files in MS Office Excel (365 Version)
go to Data Tab and select From text to CSV
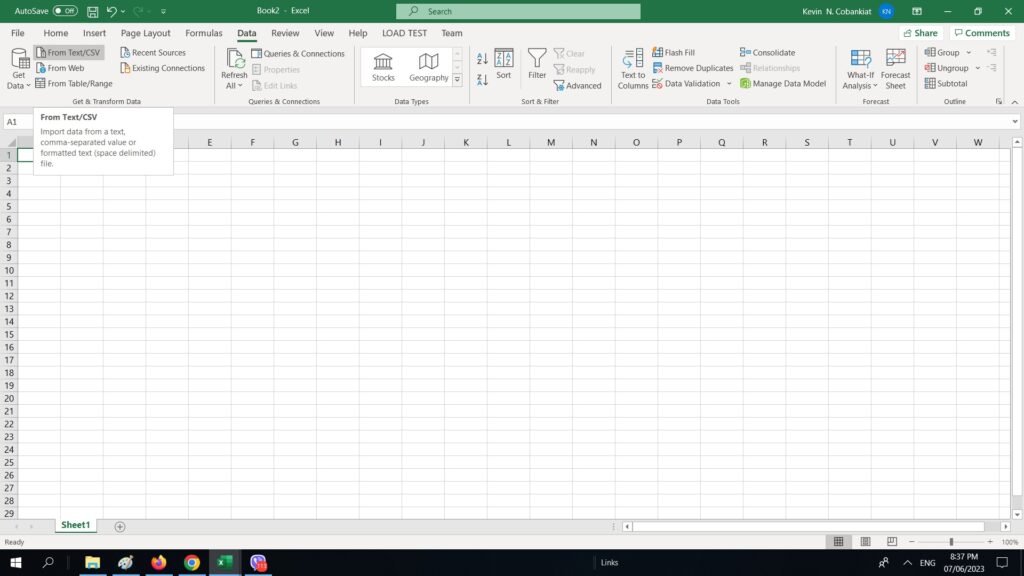
after Selecting your CSV file open it and press the load button below
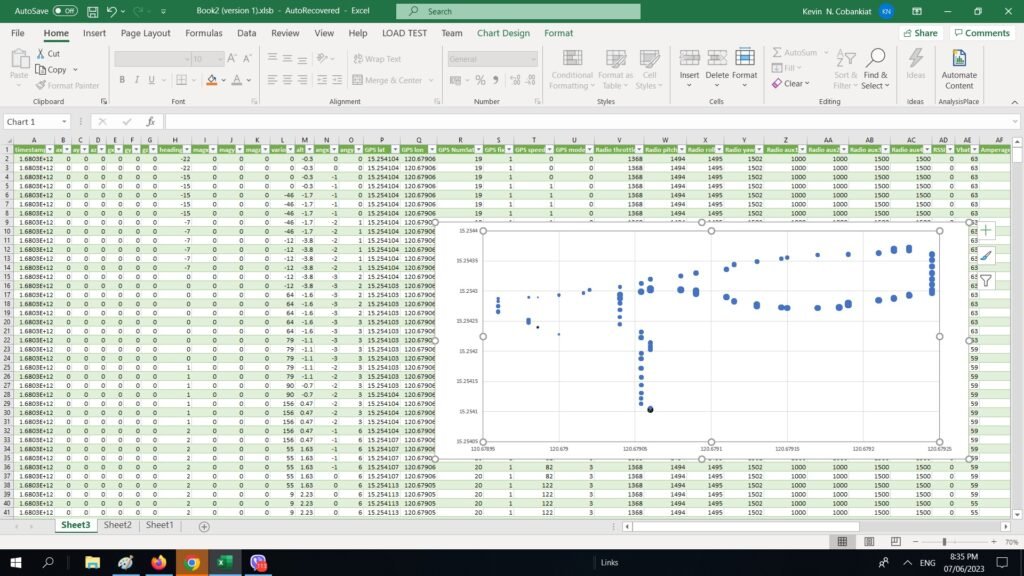
Finally from the Data you can create a Chart (in this sample a bubble scatter chart)
EZGUI Logging
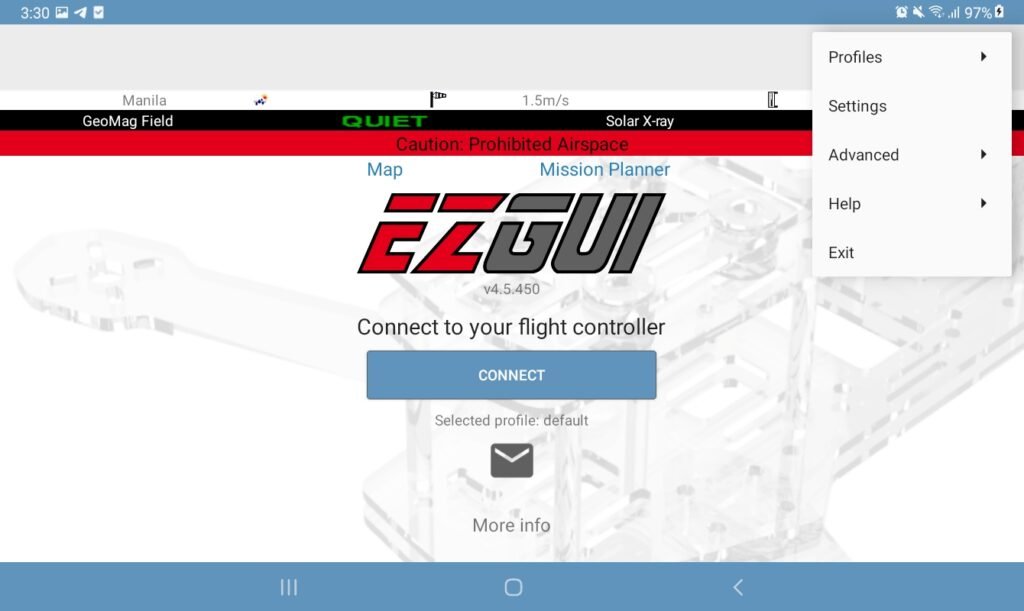
for those who Prefer using a Phone or Tablet you need to first download the EZGUI Ground station apk to your device (Developer mode and security install from external source may be required)
Setting up your BT Connectivity firmware version
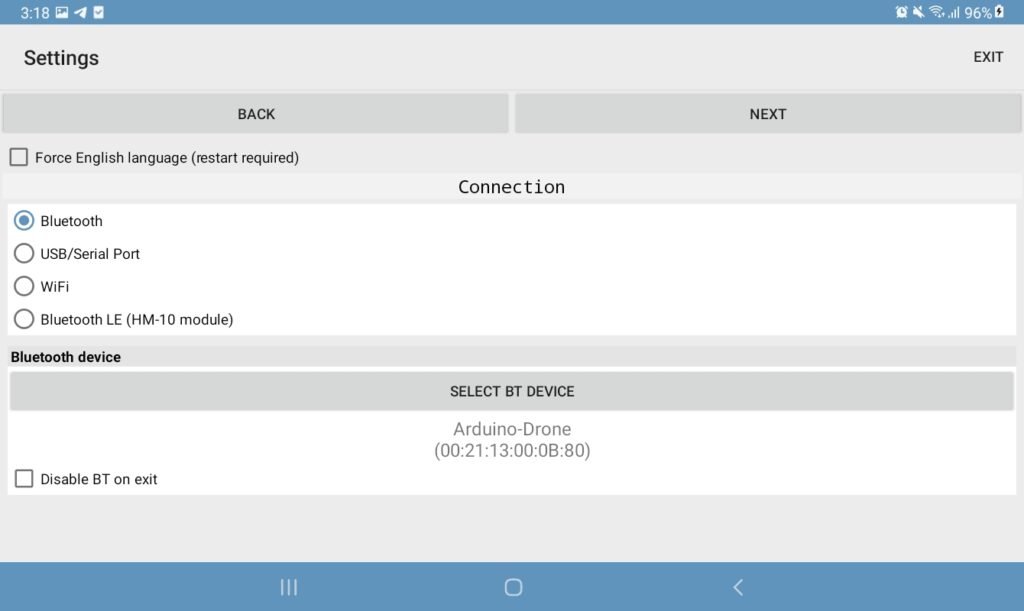
first you need to go to Settings …
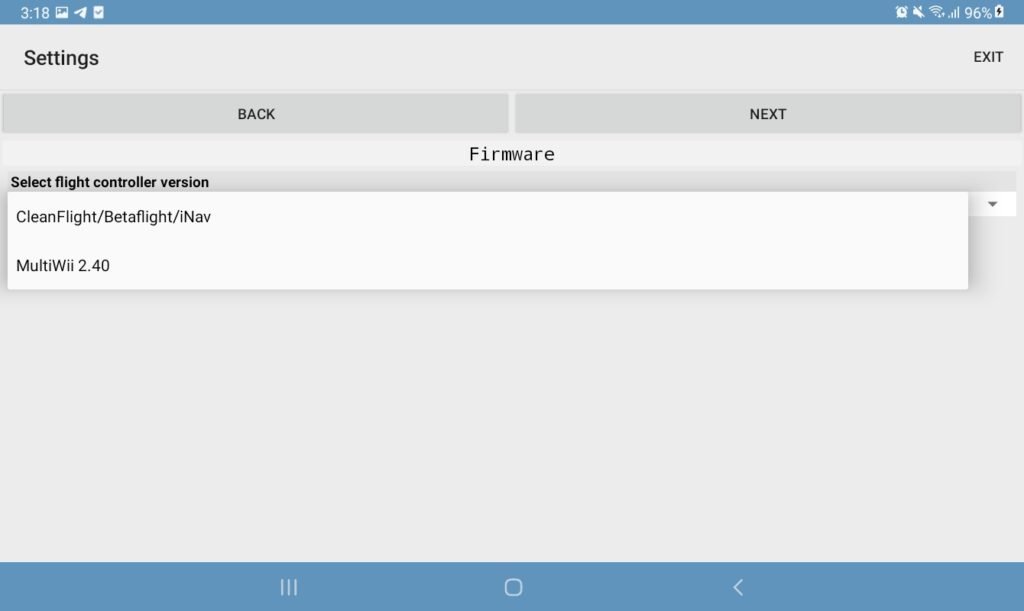
connect by Bluetooth then click next and setup the correct Firmware
- Synerduino Arduino – Multiwii 2.4
- Synerduino STM – Cleanflight/BaseFlight/INAVthen
then exit would auto save it
Logging the flight data
connect the bluetooth and on the Dashboard look for the Settings Tab > logging Button and Logging button
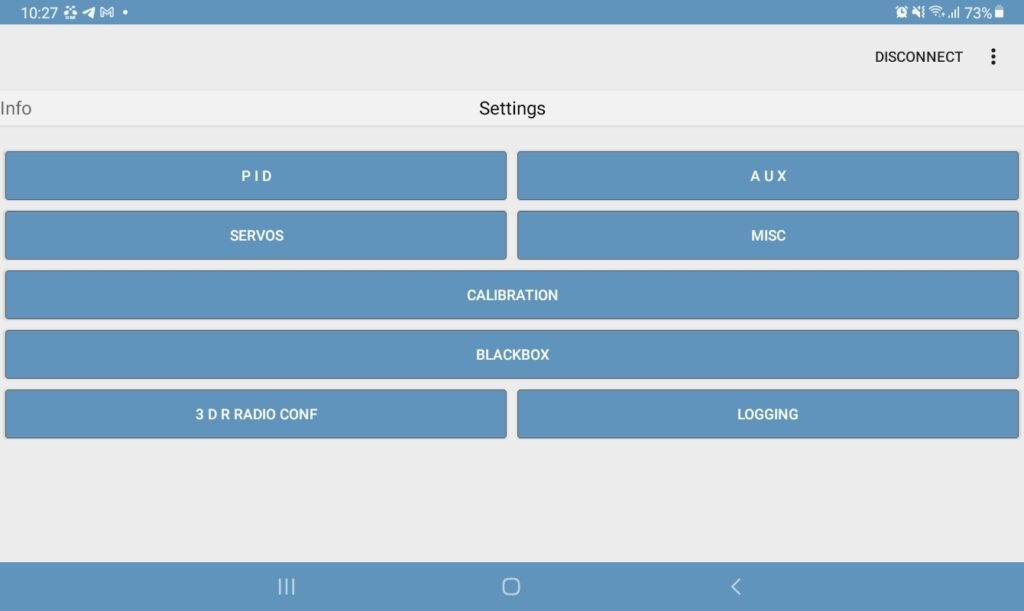
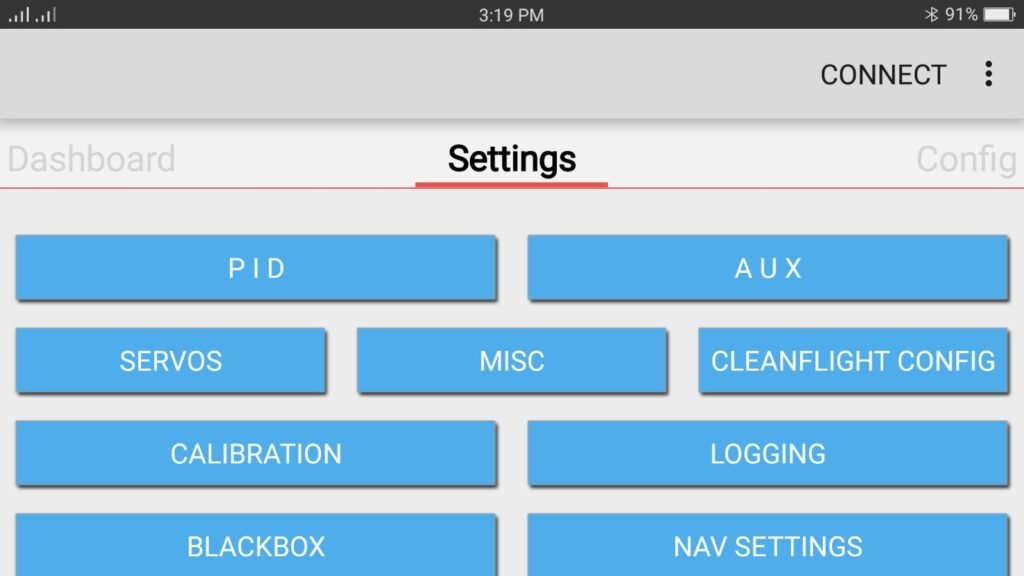
You’ll Have two options to Auto start Logging when Arm or manually hit the Logging button – this would save the file as EZ-GUI>Logs> .el2 File extention in your device
to Analyze and convert log see the log converter app .


Converting Logs to KML CSV
Required to download EZGUI Logs Converter
Select the Date/Time of your Log . the Length of the Log is also present
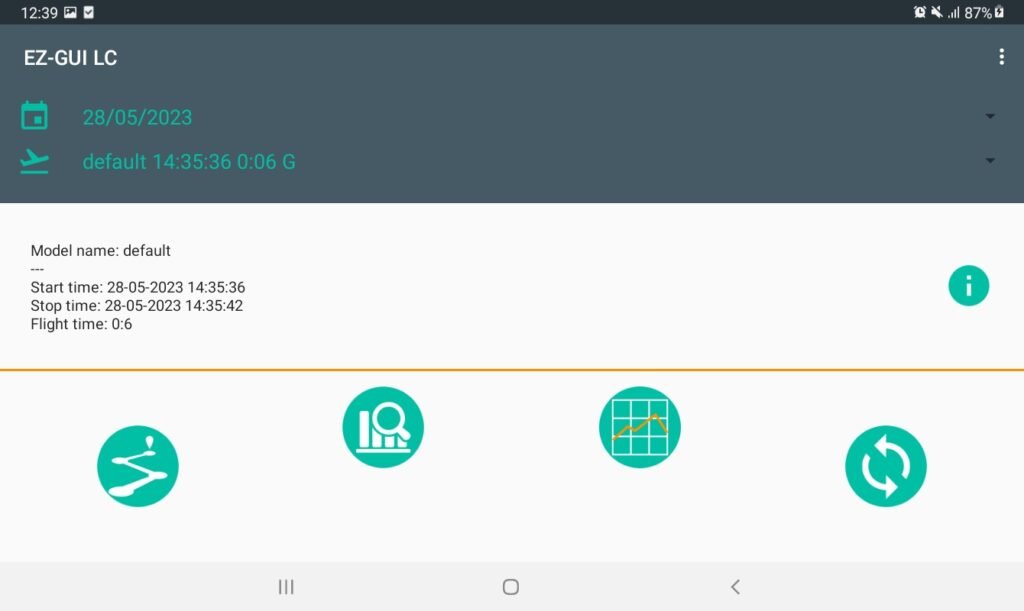
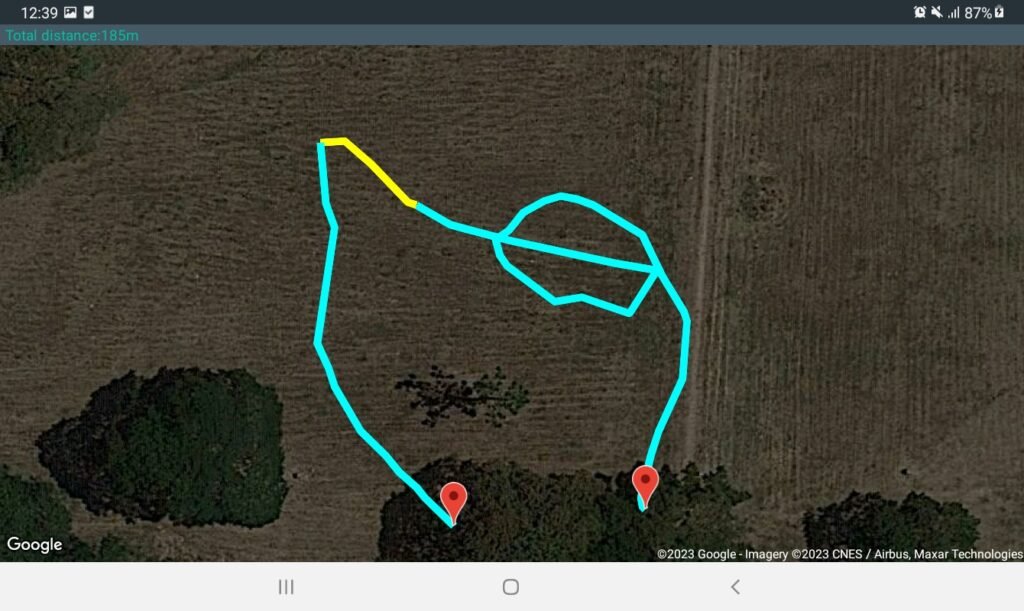
Flight Path mapping
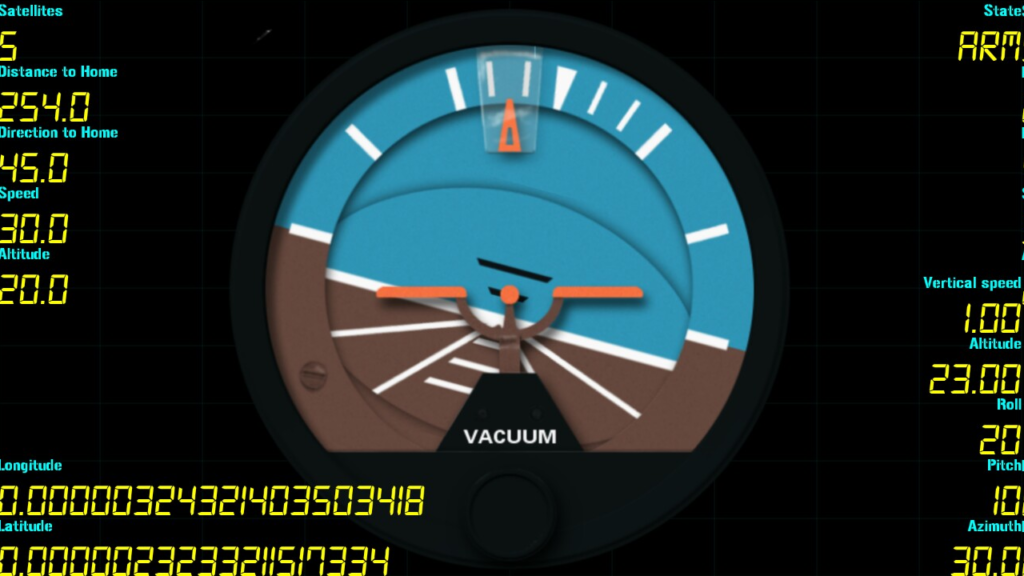
Flight performance status
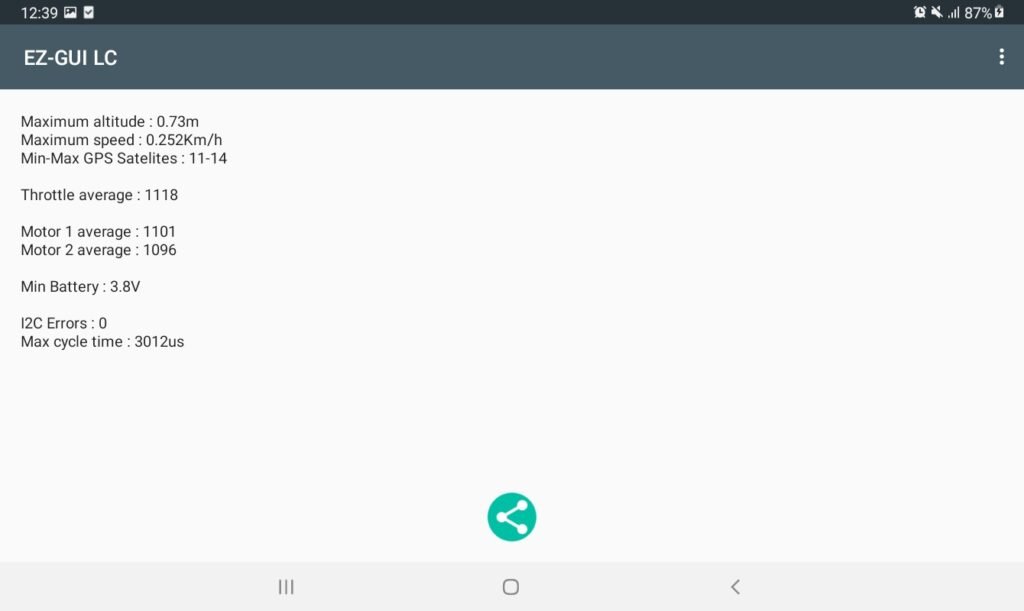
IMU and Performance Logs

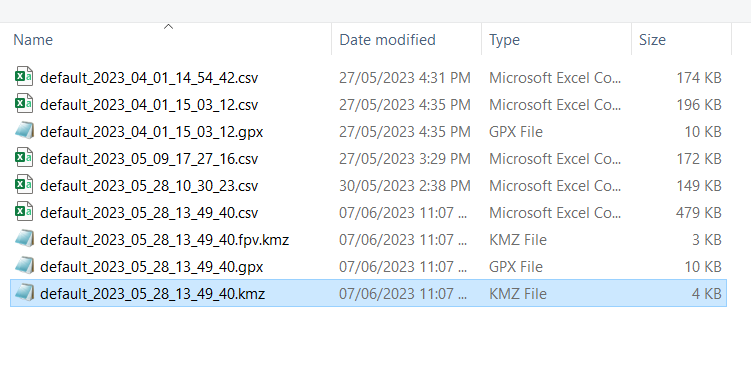
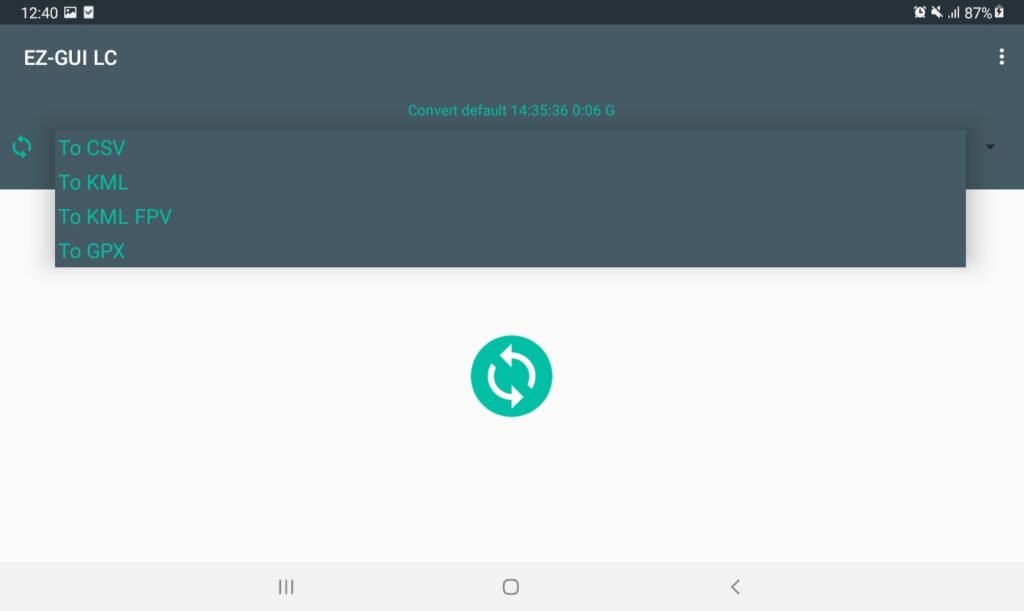
Export CSV KML/KMZ GPX
this is generates an output in the EZ-GUI>Converted_logs folder and this is where we download to our MS Excel or Google Earth information
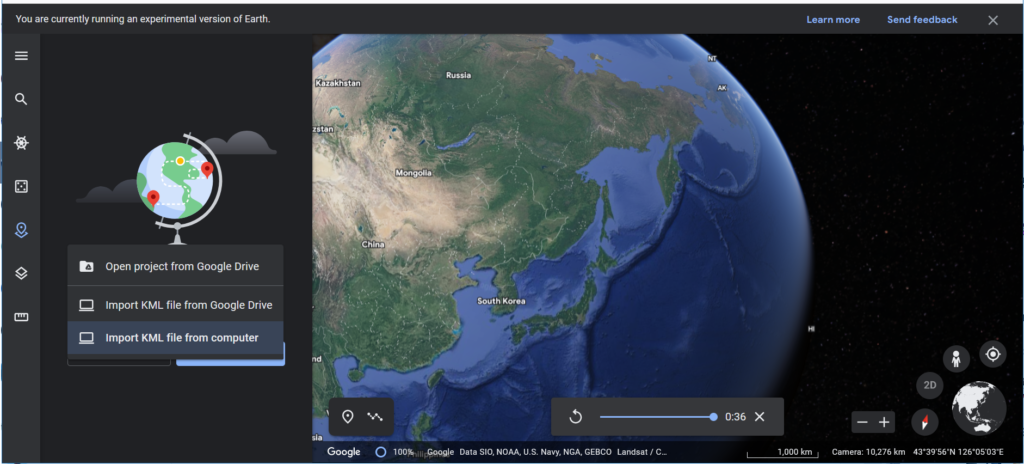
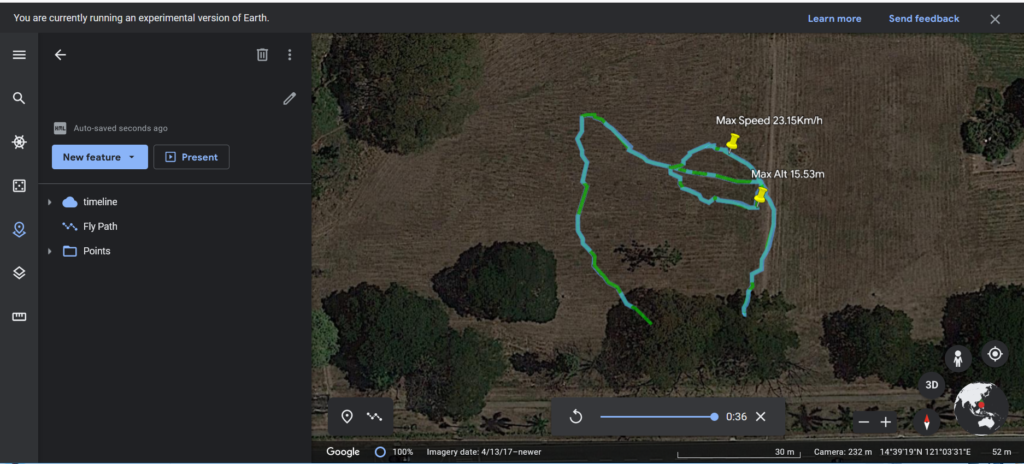
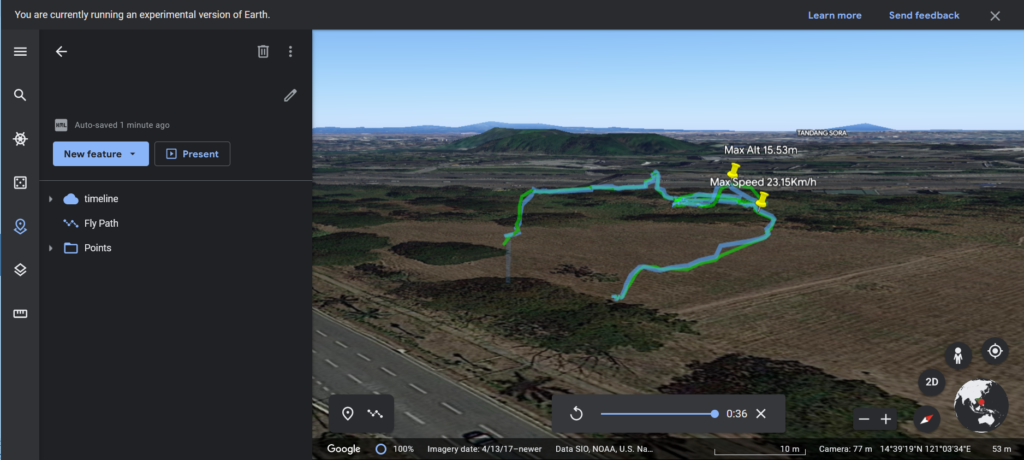
Google Earth
Go to projects tab
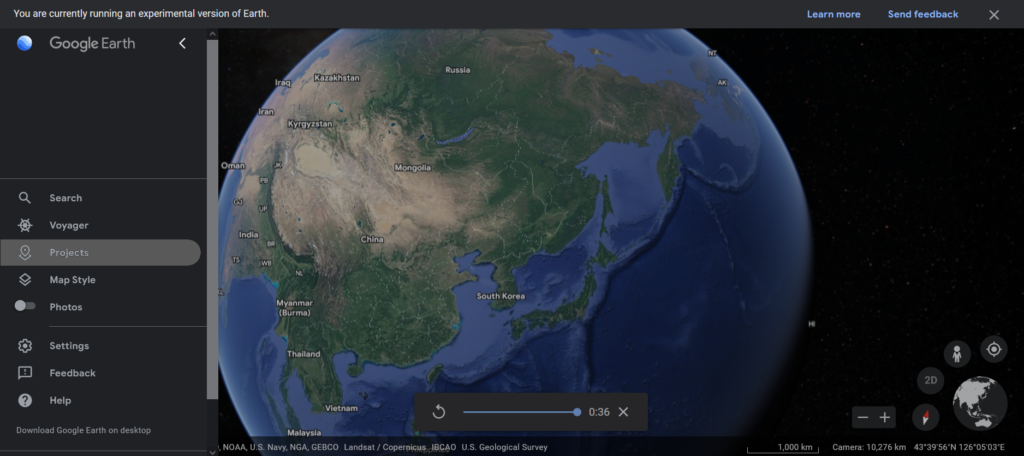
if you have created an KML/KMZ from the Log import it to Google Earth