How Can We Help?
Gas Sensor
There Was a research paper posted in 2020 speaks about utilizing drones for environmental monitoring for Air quality and to find our on the attach PDF. and to see our for your self its possible now to implement directly to the synerduino platform as such.
A Function rarely discuss about when it comes to building drones is the fact the same controller can not only log the vehicles vital systems but the environment around it. this was possible Flywiigui18 and Synerflight FlyWii Firmware allowing to use A0 ,A12,A13, A14 & A15 Pins for external sensors . essentially turning the drone into a mini flying instrument platform in its self. where LOGs can be exported and Rename as as CSV or XLSX format allowing you to graph the data.
ADC to PWM Data
PWM – 1000ms-2000ms Value
ADC 0V-5V
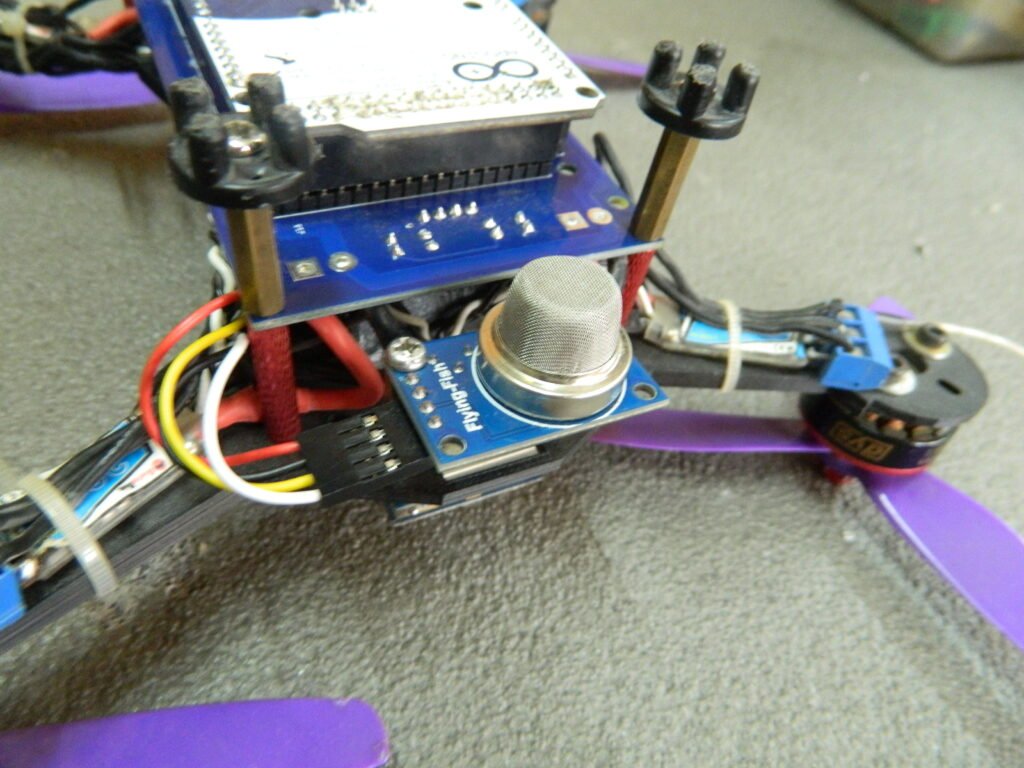
Sample Shown here is Environmental Gas Sensor installation MQ series like the MQ135

Sensor Example Calibration Process
The MQ9 sensor is sensitive to carbon monoxide and flammable gases. It can detect the detect carbon monoxide density from 10ppm to 1000ppm and flammable gases density from 100ppm to 10000ppm. MQ9 has an internal heater which starts warming up if a 5V voltage is applied.
The internal resistance of this sensor changes as the density of the detectable gases changes. This value can be read by a simple circuit. MQ9 sensor modules in the market have already implemented the necessary circuit and you do not need any extra item.
Interfacing MQ9 Gas Sensor and Arduino
In order to get correct and accurate data, you need to take the following actions first:
- MQ9 sensor needs some time for preheating time. Connect the power supply and leave for the required time until it gets ready. before transferring the Power connection to the onboard Drone controller
- You need to calibrate the sensor (We have explained this in the following section)
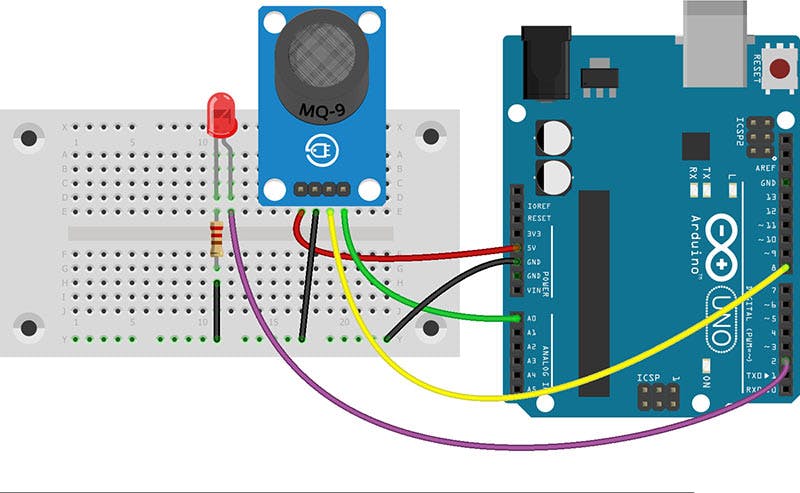
Circuit
This module has 4 pins. Connect Vcc to 5V and GND to GND. The AO pin returns an analog value based on the concentration of the gas. The DO pin returns HIGH if the concentration of gas is higher than a certain value. This value can be set by the potentiometer on the board.
Notes:1. Do not expose this sensor to water and frost.
2. Applying a voltage higher than 5V or applying the voltage to the wrong pins may damage the sensor.
3. Exposing the sensor to a high concentration of gases for a long time may have a negative effect on its performance.
4. Shaking or vibrating the sensor may decrease its accuracy.
How to Calibrate MQ9 Gas Sensor?
Before using the module you have to calibrate it. This sensor measures the gas concentration based on resistance ratio. This ratio includes R0 (sensor resistance in 1000ppm concentration of LPG) and Rs (Internal resistance of the sensor which changes by gas concentration). In clean air, after preheating, upload the following code and wait for about 15 minutes until R0 reaches a fixed value.
Code1.ino
/* MQ9 Calibration modified on 19 Feb 2019 by Saeed HosseiniHome*/ void setup() { Serial.begin(9600); } void loop() { float sensor_volt; float RS_air; // Rs in clean air float R0; // R0 in 1000 ppm LPG float sensorValue; //Average for(int x = 0 ; x < 100 ; x++) { sensorValue = sensorValue + analogRead(A0); } sensorValue = sensorValue/100.0; //-----------------------------------------------/ sensor_volt = (sensorValue/1024)*5.0; RS_air = (5.0-sensor_volt)/sensor_volt; // Depend on RL on yor module R0 = RS_air/9.9; // According to MQ9 datasheet table Serial.print("sensor_volt = "); Serial.print(sensor_volt); Serial.println("V"); Serial.print("R0 = "); Serial.println(R0); delay(1000); }
As you see in the code, we have averaged from 100 data to achieve a stable value. Then we measure the sensor voltage and according to RL restance (in our case, 5K), we calculate Rs. Then according to the table available in the datasheet, R0 can be found.
Code2.ino
NoteIn the following code, replace R0 with the value you achieved in the previous step.
/*
 MQ9
 modified on 19 Feb 2019
 by Saeed Hosseini
 Home
*/
const int LED = 2;
const int DO = 8;
void setup() {
 Serial.begin(9600);
 pinMode(LED, OUTPUT);
 pinMode(DO, INPUT);
}
void loop() {
 int alarm = 0;
 float sensor_volt;
 float RS_gas;
 float ratio;
//-Replace the name "R0" with the value of R0 in the demo of First Test -/
 float R0 = 0.91;
 int sensorValue = analogRead(A0);
 sensor_volt = ((float)sensorValue / 1024) * 5.0;
RS_gas = (5.0 - sensor_volt) / sensor_volt; // Depend on RL on yor module
 ratio = RS_gas / R0; // ratio = RS/R0
//------------------------------------------------------------/
 Serial.print("sensor_volt = ");
 Serial.println(sensor_volt);
 Serial.print("RS_ratio = ");
 Serial.println(RS_gas);
 Serial.print("Rs/R0 = ");
 Serial.println(ratio);
 Serial.print("\n\n");
 alarm = digitalRead(DO);
 if (alarm == 1) digitalWrite(LED, HIGH);
 else if (alarm == 0) digitalWrite(LED, LOW);
 delay(1000);
}
What’s Next?
- Find the gas concentration in PPM with the help of the table.
- once you got the sensor calibration this can serve as a control sensor to help you configure the onboard sensor of the drone

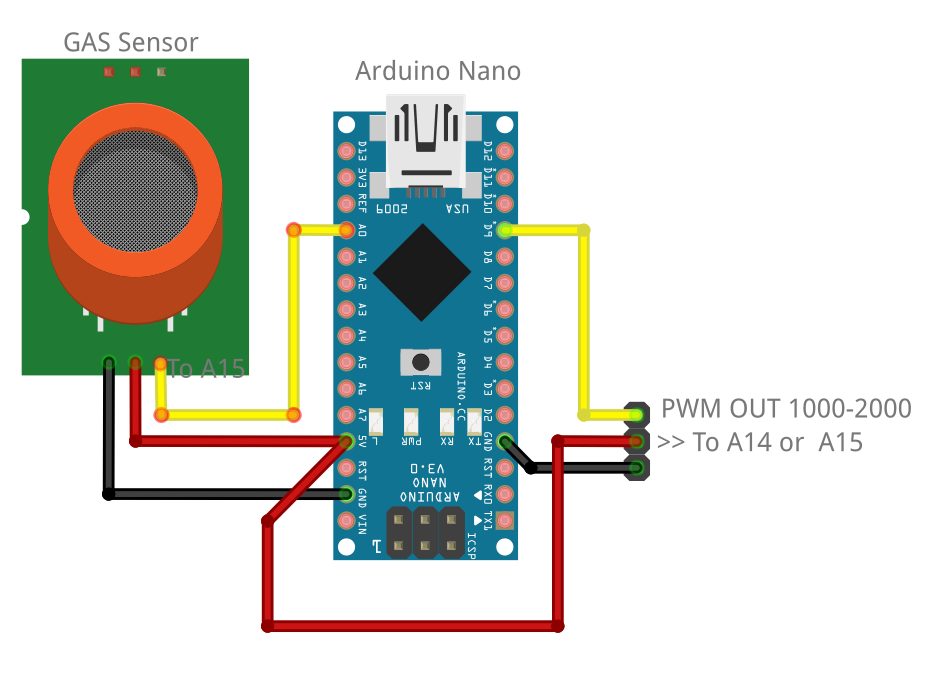
GAS Sensor Synerduino Drone implementation
DRONE PWM SENSOR.INO
//Gas sensor input to output
//A0 > D9
//A1 > D10
//A2 > D11
//A3 > D12
//use servo command to convert the ADC output of the Sensor into PWM and this PWM output is read by the Synerduino shield

#include <Servo.h>

int smokeA0 = A0;

Servo servo_pin_9;
Servo servo_pin_10;
Servo servo_pin_11;
Servo servo_pin_12;

void setup()
{
  pinMode(smokeA0, INPUT);

  Serial.begin(9600);

  servo_pin_9.attach(9);
  servo_pin_10.attach(10);
  servo_pin_11.attach(11);
  servo_pin_12.attach(12);

}

void loop()
{
  int analogSensor = analogRead(smokeA0);
  Serial.print("Pin A0: ");
  Serial.println(analogSensor);
  servo_pin_9.write( ( analogRead(A0) / 2 ) );
  servo_pin_10.write( ( analogRead(A1) / 2 ) );
  servo_pin_11.write( ( analogRead(A2) / 2 ) );
  servo_pin_12.write( ( analogRead(A3) / 2 ) );
  delay( 100 );
}
Note : the shield is rated at 1.5A on its onboard regulator should you needed more than 1 sensor considering getting a 5V UBEC or a Buck Converter Output plug into the PWM pins for extra capacity.
ADC Direct to A0 Pin (Synerduino V1.1)
ADC Sensor Direct to A0 Pin is available on the Synerduino V1.1 Board and can be setup in this manner (Aux In Jumper Pad must be Open & Reg In Pad Shorted) to access the A0 Pin . A0 Pin also on the sensor board

For More Sensors its require an External BEC to supplement the Power Requirements

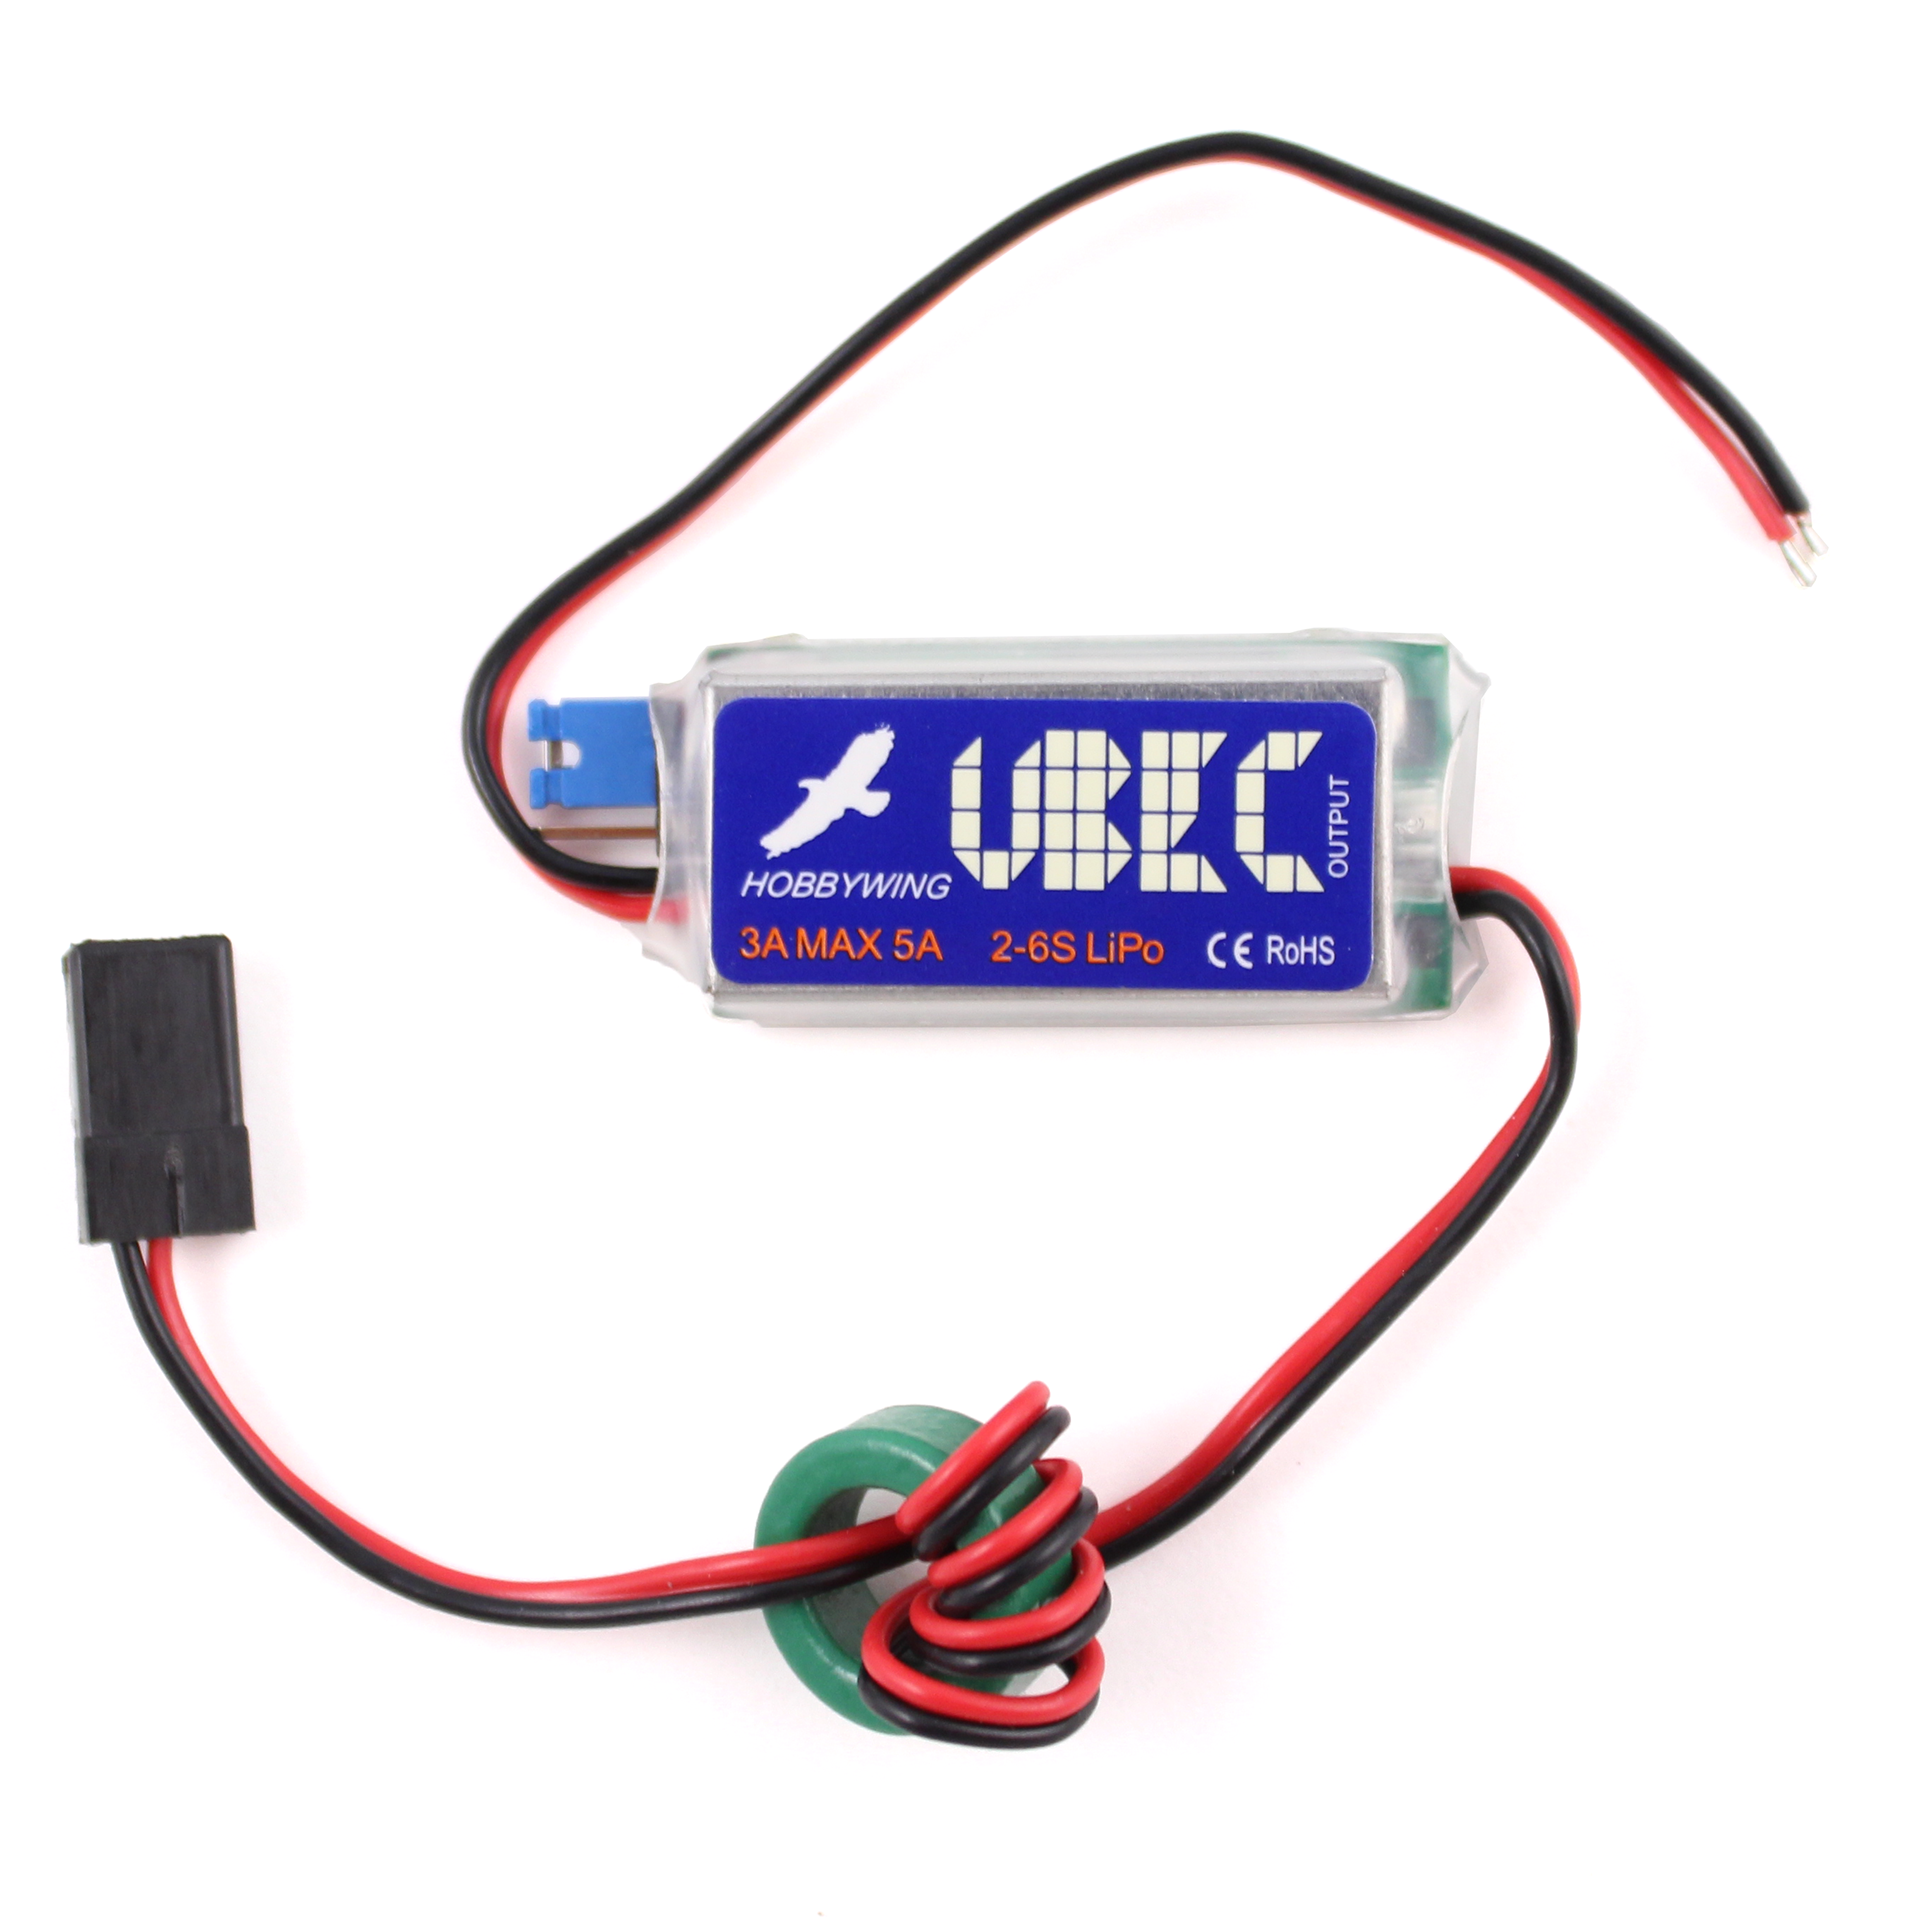
Should more sensors are required an External BEC may be required to support the additional current load
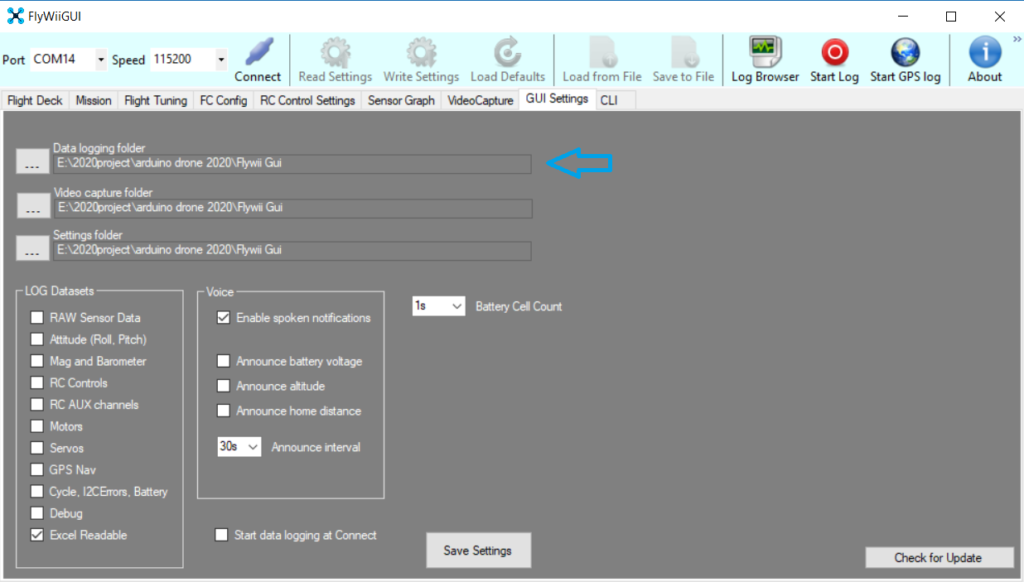
FlyWii GUI Setup
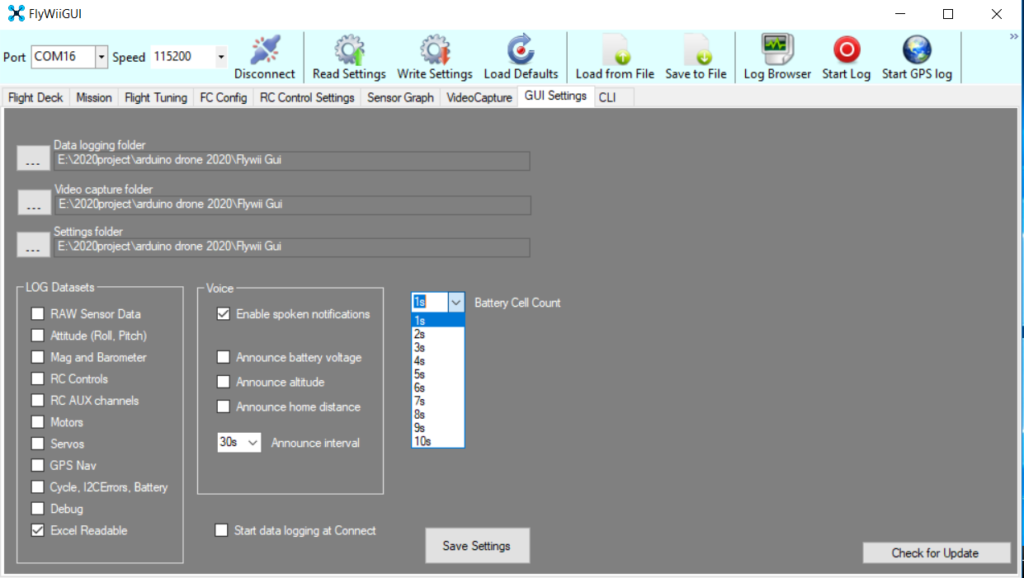
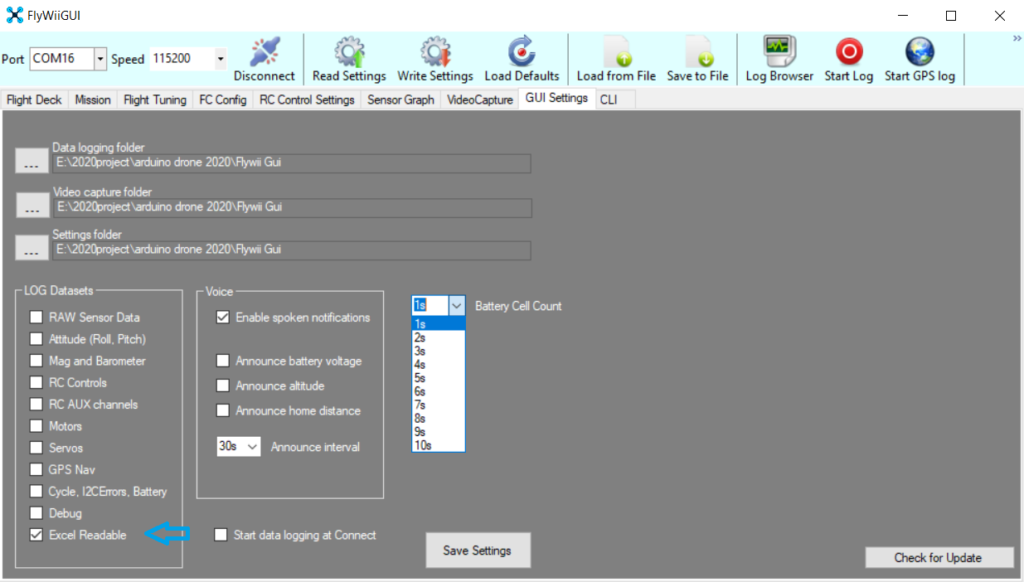
First connect the Drone and go to GUI settings and Change the Battery Cell Count to 1s as we are using it for sensor signal mode.
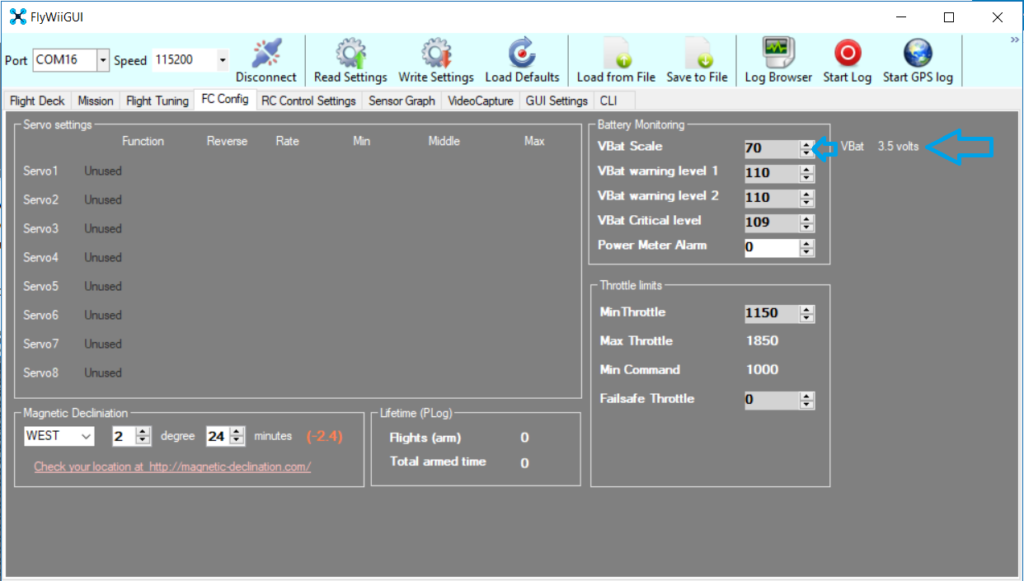
Use the Vbat scale to adjust the output till the number Matches the ppm concentration numerical value of the Control Sensor
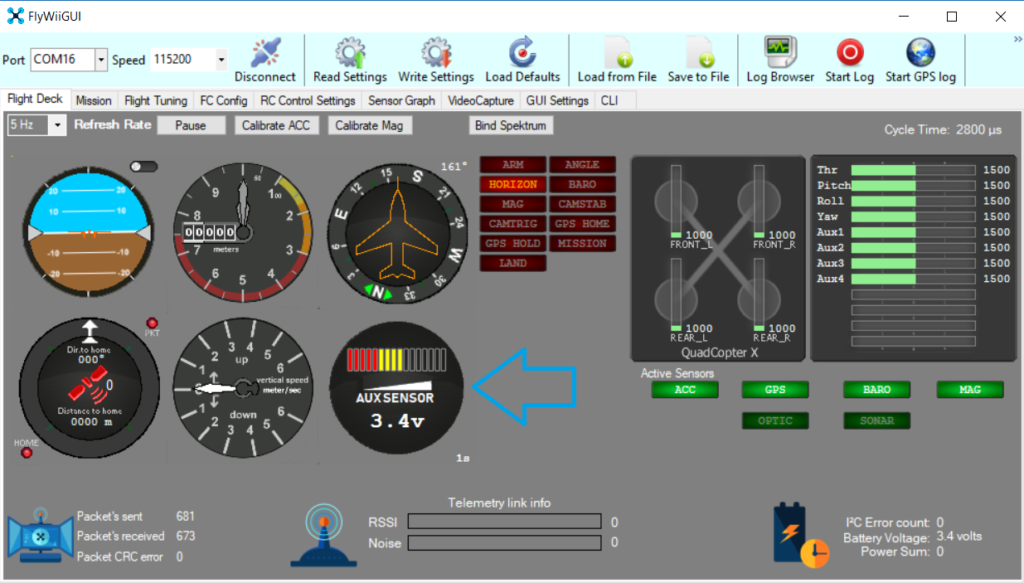

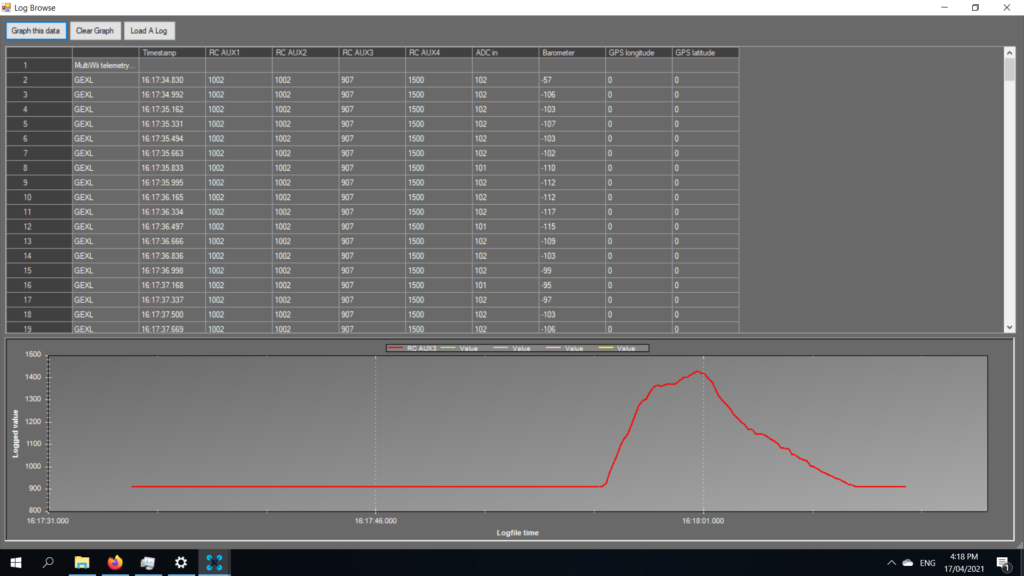
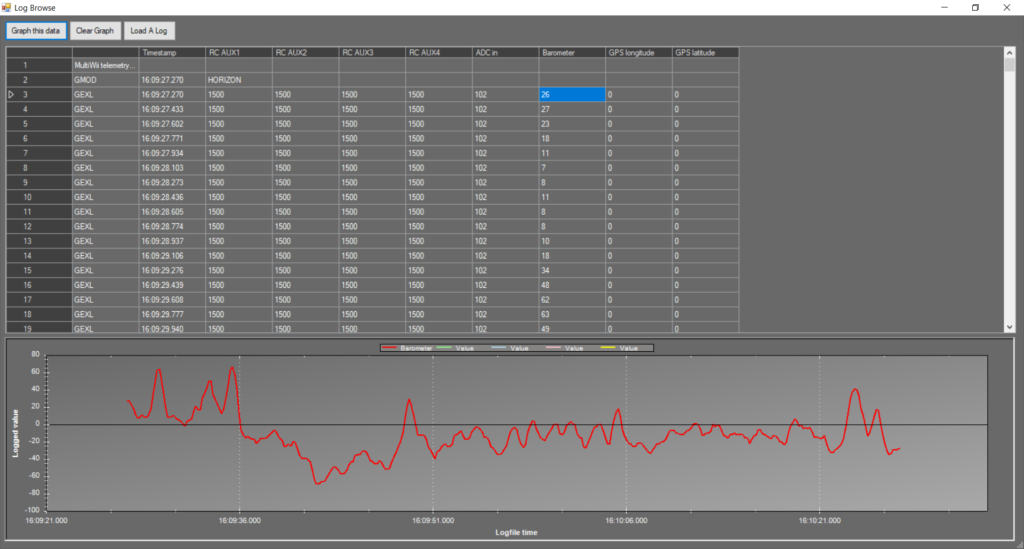
Note: that for the Ao ADC sensors in this sample the Graph selected is the ADC in
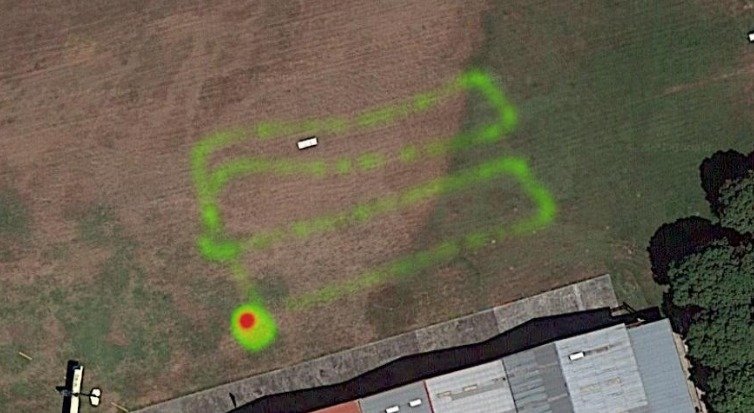
Open .log files in MS Office Excel

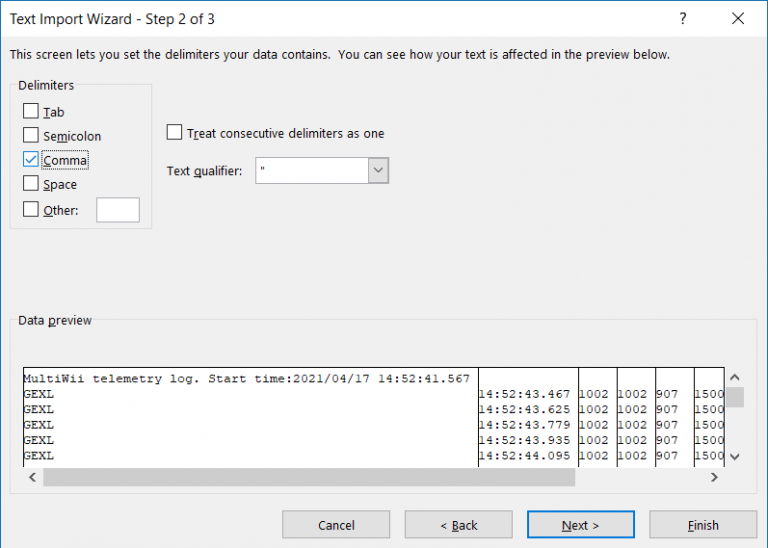
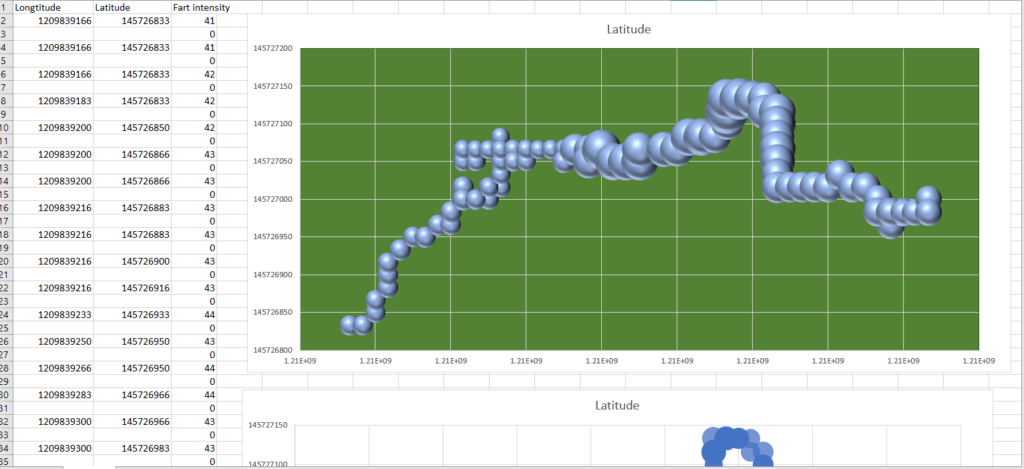
Data is best presented as Scatted Bubble Chart Longitude-X Latitude-Y Bubble size as ADC in to be on your graphs . Aux 1-4 may be used if your sensor happends to be augmented with RC PWM standard
This shows a bubble chart of the coordinates the samples were taken and the Bubble size of the intensity of concentrations.

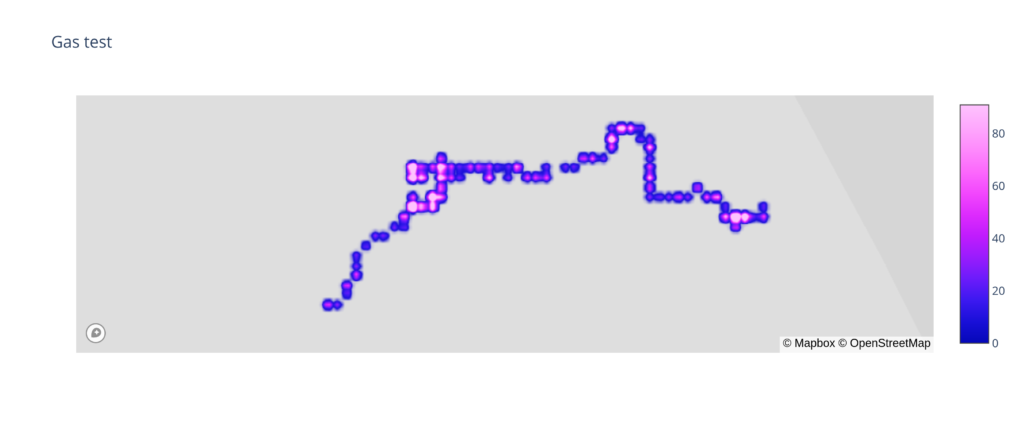
http://www.synerflight.com/project/plot1gas/